As a Braves fan, I’m constantly having to remind myself that my team isn’t the reigning division champion (or the victim of a first-round playoff exit) going into the 2007 season. After many years of trying, the Mets finally caught us last season — only to see their hopes die at the hands of ex-Brave prospect Adam Wainwright. This author certainly appreciates the delicious irony in this, although it does not come close to making up for missing the playoffs.
 Still, the question remains — how much distance separates the Braves and the Mets this year? Based on their 2006 performance, the Mets were 18 games better, a seemingly-insurmountable gap. Since the end of the season, both teams have primarily treaded water; the Braves upgraded their bullpen with Mike Gonzalez and Rafael Soriano, while the Mets signed aging Atlanta-born slugger Moises Alou to shore up left field.
The best way to predict 2007 is to use a simulator that includes projected statistics and playing time for the rosters we expect all teams to use. However, that’s a huge pain, so I looked for a simpler way. Cheer up, Braves fans! The picture doesn’t seem as bleak anymore.
As I said before, the Braves were 18 games behind the Mets when the 2006 regular season came to a close. However, if we look at their Pythagorean records, the difference isn’t nearly as large.
Aside: a team’s Pythagorean record is based on a formula developed by Bill James, so named for the similarity in it he saw to Pythagoras’ method of calculating the length of the sides of right triangles. It uses the number of runs that a team both scores and allows to estimate how many games that team should have won. The formula makes sense: teams that on average outscore their opponents (as the Braves did in 2006) should win more than they lose. Sometimes this doesn’t happen; studies have shown that a poor bullpen (another feature of the 2006 Braves) is one of the main reasons why a team will win fewer games than James’ formula says they should.
Based on their 2006 Pythagorean records, the Mets only outperformed the Braves by 6 games (91 wins to 85). So that’s cause for optimism, right?
To answer that question, I dove into the data. Using Access and Excel, I calculated the actual and pythagorean winning percentages for every team in MLB since the 1947 season. I then calculated their winning percentage in the following season. Finally, I ran two regressions. The first explained year 1 winning percentage based on year 0’s actual winning percentage; the second explained year 1 winning percentage based on year 0’s pythagorean winning percentage. If my hypothesis were correct, the second regression should explain more of the year-to-year variation in winning percentage than the first.
Happily for the Braves, this turns out to be the case. Pythagorean win% in year 0 explains more of the variation (34.8% to 31.9%) and correlates better (59.0% to 56.6%) to year 1 win% than does actual year 0 win%.
Using the formula that Excel spits out, I calculated an expected winning percentage for the Braves and the Mets in 2007 based on their 2006 pythagorean winning percentages. It’s a very rough way of predicting the future, and certainly doesn’t work in cases where teams changed significantly over the offseason, but is a good first step in making a prediction.
According to that formula, the Braves should win 84 games next year while the Mets should win 87. I think this is about right; the Braves are entering 2007 as underdogs for the first time in a long while, but they’re not far off. Mets fans expect the gap to be as big as Mike Strahan’s teeth. They’re going to be sorely disappointed.
 According to Jon Heyman of Sports Illustrated,
 Wow. My guess of 6 years, $85 million seemed high to me at the time, and I was off by two years and $51 million in guaranteed money. Oops!
 Nomah had a nice little season last year, although he was unable to shake the “fragile” label he’s acquired of late and played just 122 games. When he played, he played well, posting an .870 OPS in the hitter-unfriendly confines of Chavez Ravine. You’d think the Dodgers would look elsewhere, considering the way James Loney played last year when Nomar was hurt, but they’re rumored to be the front-runners. Colletti will get a deal done this week for more money than you might expect: 3 years, $24 million guaranteed.
 Now that he’s finally escaped Pittsburgh, perhaps Craig can find a place where he can be handed a position and allowed to play it relatively free of interference. Although he’s played at least 115 games in four seasons, he’s never played the same position more than 89 times in the same year, a testament to how frequently the Pirates jerked him from position to position (as well as in and out of the lineup). Wilson’s best days are likely behind him, but he remains a career .265/.354/.480 hitter who will be just 30 next year. The Orioles could use Wilson either at first, in the outfield, or as a DH, and would be well-advised to sign him to a 2 year, $12 million deal, but will probably waste the rest of their budget on relief pitching instead.
 A few days ago, this blog
 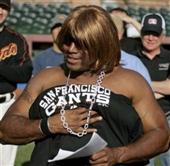 Let’s see: everyone in the country outside of San Francisco hates this guy. That said, he can still hit (when he plays). A move to the AL so that he could DH makes sense, but he’s almost too radioactive for an AL team to sign. A last hurrah with the Giants to break the home run record for about $12 million seems about right, but more years wouldn’t be all that surprising. By the way, how ridiculous is that picture? The chances that he never used steroids are even lower than the chances the guys in Lost have of ever getting off that stupid island.

